As part of the Design Engaged conference last November there was a day when we were broken up into groups and encouraged to walk around Amsterdam and brainstorm ideas about design, technology, cities and human interaction. It was a pretty broad mandate, but we shared a similar set of interests, so many of the ideas resonates and we quickly assembled a bunch of interesting ideas about new technologies. During that exercise, I started thinking about heat maps as ways of representing things other than heat.
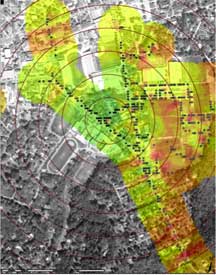
Heat maps are maps like the heat weather maps that appear in newspapers. They represent shifting gradients of temperature, as mapped to geography. In the newspaper they consolidate a lot of potential information (think of the listing of temperatures and cities that scrolls on CNN International) by keeping one variable (geography) stable and mapping another one to it. I thought "I wonder what else can be mapped like that?" and, of course, WiFi was the immediate choice, since I'm constantly checking for WiFi strength when sitting in cafes. Mapping WiFi to heat maps has been done by several groups, with the following map taken from Chris Lentz's 2003 Dartmouth Senior Thesis as one example:
My next thought was "OK, assuming that someone is going to do some semi-automated way of doing this based on the Netstumbler database [link[, what to do with this information?"
Then, I thought of all of the other information that's already bombarding me as I walk down the street looking at potential places to sit with my laptop: I often have headphones in my ears, or I'm talking on the phone, I'm looking out for traffic and reading menus, I'm trying to find a place with a table near the window. Finding the strength of WiFi connectivity is a secondary consideration at that point, and is always going to be, but the information is there, so how to get to it?
OK, I thought, so our visual sense is totally overloaded, and our auditory sense is pretty close to it, but we have a bunch of other senses that are perfectly good and relatively underused. We can map information to these other senses. One of these is heat, so why not reverse the polarity, so to speak, and take the WiFi heat map and map it back to actual heat.
That's the long windup for the pitch of the following idea:
The WiFi heat sensor
Here's the sketch from my paper notebook, from last November:
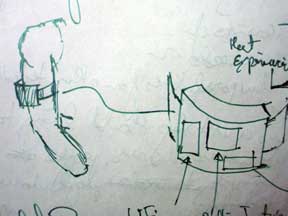
The idea is that there would be a box that you would wear that would have a WiFi detector in it, like the handheld ones that are already on the market. Rather than displaying the information in the form of LEDs, it would have a Peltier Junction, or some such heat and/or cold source in it, so it would, for example, perceptively get warmer the closer you were to a source and then perceptively cooler as you went away.
This type of shifting of data to a non-visual/non-auditory sense could have all kinds of other possibilities. Connected to a GPS (or some other way to find your place) with a database, it could tell you where there was an ATM, or a point of historic interest. Connected to a Lovegetty-like (or "Familiar Stranger"-like) device, it could tell you when there was an acquaintance nearby. It would give you a sense of the data space around you in a way that only you would know about.
My next step is to make a working one. No. Really. I have the Peltier Junctions and a hackable WiFi detector. Spidey sense here we come!

Indeed. As for me, all started from this tool: http://www.tobii.se/clearView.html which is close to eyetool.
Heat maps are a good metaphor for a whole class of data representations. Eyetools, for example, uses them to display how attention was focused on the screen, as tracked by their eye tracking product:
http://www.eyetools.com/inpage/heatmap_legend.htm
Like I said in my post, I think it's interesting to then map the heat map to actual heat as a way of representing the abstract data.
Since I work on how location-based technologies impacts small groups behavior, I use heat maps (like this one: http://craftsrv1.epfl.ch/~nova/catchbob/coverage1.png) to investigate the different portion of space visited by the player of our mobile game (Catchbob: http://craftsrv1.epfl.ch/~nova/catchbob/)
It's still a work in progress (I'm trying to find the best colors to represents the presence) but it's a good way to represent information.
This was something that came up at PLAN -- Usman Haque and Bill Gaver presented different projects that dealt with mapping wi-fi.