Recently in Personal Geographies Category

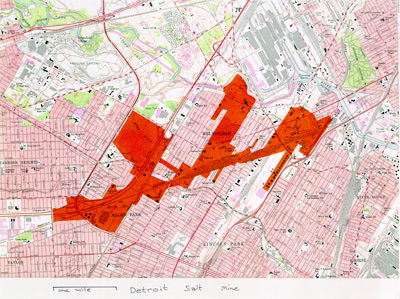
When I was kid growing up in suburban Detroit, I always knew that there was a salt mine in the center of downtown. There aren't many mines in the middle of urban areas, but one of the many strange things about Detroit is that it had one, or has one, since it's probably still down there, even though it's been closed for 20 years. I think I was sick and missed the 6th grade field trip that would have been the one chance I ever had to see it, but I saw all the big salt crystals that the other kids brought back from it and knew that the trip to the salt mine (like snowmobile safety classes) was one of the key moments of many Michigan children's childhoods.

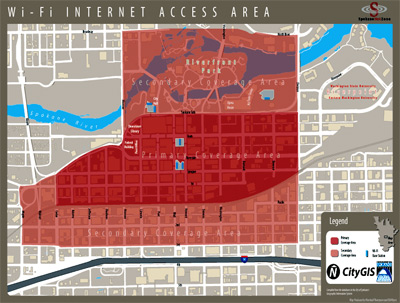
What I didn't realize was how the salt mine's operations are actually an interesting example of the kind of negotiation that happen between industry, landowners and city governments when trying to provide a city service based on a low-cost commodity resource. When telling the story to Molly the other day (based on this article), I realized that there are similarities between negotiating the mineral rites for salt and negotiating technology access for municipal Wifi, or any other kind of pervasive technological service. See, radio waves are kind of like minerals in that they don't care about property lines. The pattern of extracting salt in Detroit looks a lot like the pattern of Wifi access nodes. Compare the map above to the one for Spokane, WA:

I don't know if the similarity stops at the look of the maps, or goes deeper into how services that don't stop at property lines work in general, but I think it's an interesting analogy.

Geotagging site history

Reading a geolocation paper gave me an idea that I'm not going to implement, but may be an interesting exploration of using location as a memory aid when looking up browser history.

The idea is to use Firefox 3's new Places bookmarking and history service to store the location of where a web page was viewed, and to allow users to sort their history based on location in addition to time and alphabetically (the two current options).

Places rewrites the browser's history and bookmark capability as a single database. Being a database, it allows every entry in the database (every "entity"? I don't know my database terminology well) to have additional fields. Places defines two fields up front: Annotations and Tags (Zotro's influence perhaps?), but there's no reason that either location couldn't be squeezed into one of those fields, or defined as a field itself. You could start with the Wifi SSID. Here's a script to extract that on Mac OS X 10.4, for example:


cd /System/Library/PrivateFrameworks/Apple80211.framework/Versions/Current/Resources
airport -I | grep \ SSID - | awk '{print $2}'

Liz correctly points out that mapping meaningful physical location to either a set of GPS coordinates or an SSID ('linksys', for example) is a significant problem, but I think that SSID-based organization would be an interesting place to start. Moreover, as things like browsers become more portable thanks to dedicated browsing devices and mobile phones, using available information to associate information with location may become increasingly more valuable.

The Site Diet

I'm pretty impressed with Firefox Places in terms of the vision. It's the first rethink of an old and crusty corner of web browsing that hasn't changed significantly in more than 10 years. The Places system keeps track of every visit to a given URL implicitly (as kind of a byproduct of it keeping all activity in a database keyed to URLs) and to me this opens the possibility of many new kinds of visualizations of personal online behavior: where have I been? how long was I there? what did I do there? Google currently keeps track of that for you in its history, but that's pretty creepy. Places moves that kind of information gathering back into the sphere of the end user.

I would also like to use it to remind me of what I'm doing on the Web as I'm doing it. I get distracted by the Web easily (as I know many people do) and end up spending hours on things that aren't high on my list of priorities. I've tried many techniques to combat this and the best browser-based one I've found is the Stealth Kiwi Greasemonkey script. It's a good way to remind myself to stay focused and it works pretty well, but it's a pretty crude solution, kind of stomping on my web use regularly. With the Places API, I imagine having a Site Diet countdown timer next to each URL. I could in advance define how many times I felt I was allowed to visit a site per day or per week (I suspect it would be a default for all sites, with some exceptions, much as Stealth Kiwi works now), and when that countdown timer expired, well, that was it: no more checking my friends photos on Flickr or reading about embarrassing hometown political scandals until tomorrow.

I think it would be pretty straightforward to write Firefox extensions to do either the location-based history or the Site Diet, but I'm too busy making ThingM go, so here, Internet, you can have these ideas. ;-) And thank you Firefox team!
(click for interactive version, courtesy of Platial)

Stewart Brand talked about how building learn, and defined a set of what he called shearing layers. The bottom-most layer of his shearing layers is "Site," which states that the site is eternal. That's certainly true, to a point. Dubai's The World is not an eternal site: it's being built right now, and much of San Francisco is on landfill. However, eternal or not, once the boundaries of site are defined, it's very difficult to change them. Many Italian towns, such as Siena, still show the traces of the Roman coliseums that dominated their centers two thousand years ago, even though the coliseums and the buildings all around them, are long gone.

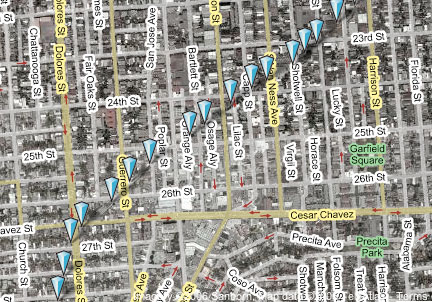
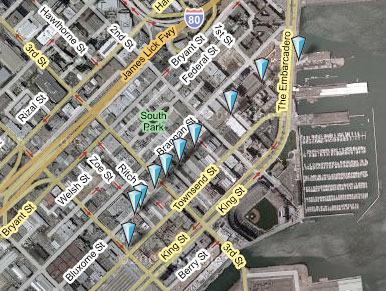
Modern cities have this, too, and they learn at an urban level. I decided to follow up on an observation my friend Jim made some years back. He told me that you could see where the old railroad right-of-way used to pass through his part of the neighborhood we both live in. San Francisco used to be dominated by railroads which, probably much more than the Gold Rush, built the city in the 19th century. However, throughout most of the 20th, these railroads have been systematically dismantled. Generally, they were dismantled after neighborhoods had grown up around them, and as the railroads sold off the land where track used to lay, the pieces they sold were not necessarily in line with the SF street grid. Even through as much as 100 years may have passed since a right-of-way was sold, undoing all the funny shaped pieces of land is difficult and expensive, so developers build in what's available. What you get then, and what's visible from a satellite map, is a picture of the paths which used to snake through San Francisco, defined by connecting the dots of funny-shaped buildings.

I've made two of these Urban Palimpsests, as I'm calling them, using Platial. The first (on the left, above, of the SOMA area of San Francisco, where I used to have an office. The second is of the area that Jim talked about, tracing the path of a big rail spur through much of the Mission.

I've found several other such railroad palimpsests in the city, each of which reminds me how some decisions are imperceptibly permanent and how the most seemingly permanent things are sometimes temporary.

After a discussion with a bunch of nice folks about mapping systems over dinner the other night, I started to think about how all of the point-wise mapping tools (such as Platial and Plazes) are to me, personally. For the most part, they're not (I prefer regions as the unit of markup, or at least in addition to points). Last night Liz and I were talking about San Francisco real estate and the subject of Ellis Act evictions came up. In the process of researching this kind of eviction, we found that there was a list of Ellis Eviction sites which hadn't yet been mapped (well not to our knowledge), so we decided to try our hand at a mashup. It was harder than it's made out to be, and by the end of the evening we had given up on the Javascript and GIS systems, but had discovered several useful tools.

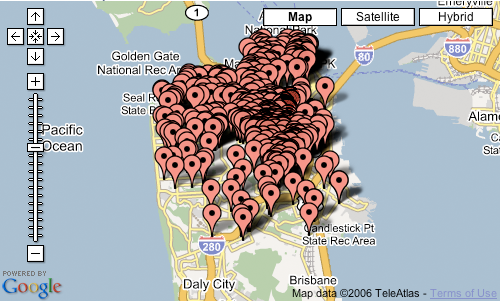
Here's the problem, as I see it, with point-wise mapping of information: when there are enough points, it becomes a forest and it's no longer useful. For example, here's the Ellis data all mapped together on SF using EditGrid, an online spreadsheet that can take any map data and map it with Google maps:

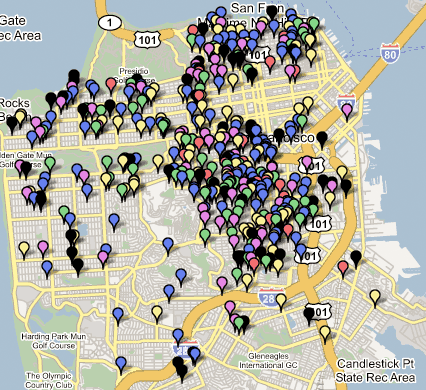
I would like to do is to have some interesting ways of clustering or displaying this information in a way that's not overwhelming visually and not a bear to produce in a GIS system. [Note to GIS system designers: your general purpose tools, which can be used for everything from prospecting for oil to identifying crime patterns, are incredibly difficult to use because they're so general purpose. Just because there's a latitude and longitude attached doesn't mean that the same tool is useful for everything. A nail and a can of peaches are both made of metal, but that doesn't mean you can or should use can openers and hammers interchangeably. Geographic information is like metal: it's a basic material, and the tools you use with it should be tuned to the task. But I digress.] Unfortunately, neither Liz or I was unable to find any such tools (EditGrid is relatively easy, but what I'd like is the equivalent of the Excel chart wizard for maps, and they're still in the early days of integrating their product with Google). We did what we could with what was available (in this case, Mapbuilder.net). Here's a still of all of the Ellis evictions from January 2000 to March 2005. You can start to see trends in both location clusters and in time and this tells a story about real estate in San Francisco. I'm not totally sure what story it tells, but it's a start, and an interesting mapping experiment to have spent an evening on.

Key:
2005-red (Jan-March)
2004-blue
2003-green
2002-purple
2001-yellow
2000-black

Click on the map to get a live, zoomable, scrollable Google Map, but be warned: Google Maps isn't very good at displaying 500 points on a map and it'll bog down your browser for a while.

If you'd like to use the data yourself, here's my dated and geocoded spreadsheet, which we used the excellent and free Batch Geocode utility, which we also used to convert the dataset into a KML file for Google Earth.

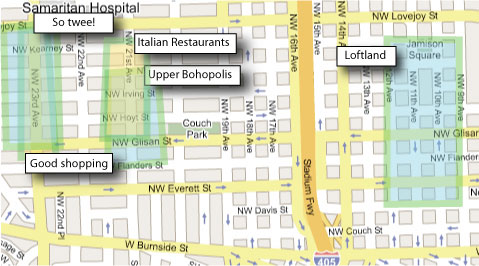
In the last couple of months Liz and I have become friends with Jason and Di-Ann in Portland. They have a new startup called Platial. Platial is one of the sites in the cluster of social geographic bookmarking sites which are appearing (Tagzania and Plazes are two others, I think there are probably at least 6 more in the field). Its aim is to let you create a personal geography of interesting points. For example, I put in my childhood home and added a couple of tags. However, it's the only point I've put in, and I started to wonder why. For me, it's because none of these systems support one of the primary ways I think about personal geographies, which is in terms of regions.

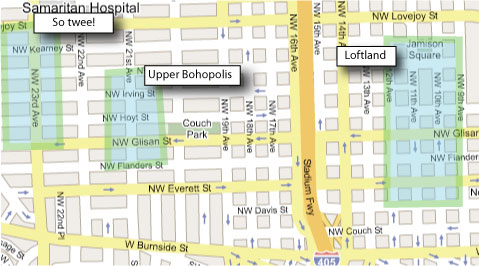
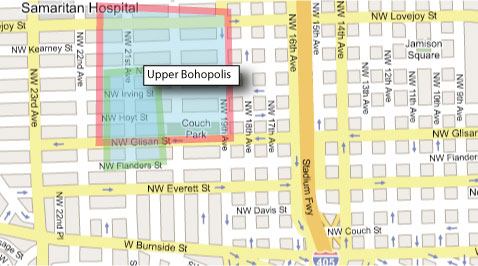
For example, in addition to locating the specific place where Powell's books is located in NW Portland (where we live), I'd like to be able to identify regions of the place.

With this idea, people could add multiple tags to the same region...

Or different people could use the same tag with multiple regions, so that, like with other kinds of folksonomies, there wouldn't necessarily have to be agreement in the meaning of a term, but the variation would be informational in itself.

The general idea is that I think in terms of regions of activity, rather than clusters of points, when I'm thinking of personal geographies. If you look at the Google/Flickr memory maps you will notice this, too. Occasionally there are points or things that can be defined as points, but for the most part, it's areas.

[NB: "bohopolis" is my term for the fragmented bohemian city that I live in; whether it's the Mission District of San Francisco, Friedrichshain in Berlin, the Alberta Arts District in Portland, Corktown in Detroit, the East Village...it's all the same city, just unevenly distributed]

Ads

Archives

ThingM

A device studio that lives at the intersections of ubiquitous computing, ambient intelligence, industrial design and materials science.

The Smart Furniture Manifesto

Giant poster, suitable for framing! (300K PDF)
Full text and explanation

Recent Photos (from Flickr)

Smart Things: Ubiquitous Computing User Experience Design

By me!
ISBN: 0123748992
Published in September 2010
Available from Amazon

Observing the User Experience: a practitioner's guide to user research

By me!
ISBN: 1558609237
Published April 2003
Available from Amazon

Recent Comments

  • Katherina: Information not just material. In our days it is a read more
  • tamberg.myopenid.com: Hi Mike, totally agree on building the IoT in a read more
  • Mutuelle: Man is the reflections of his thought, some name it read more
  • Amanda Carter: You obviously placed a great deal of work into that read more
  • Molly: You might find it interesting to connect with return of read more
  • George: You might want to change "Size" to "form" for terminal. read more
  • Mike: Thanks for the reminder, Robin. I'm aware of that article, read more
  • Robin: It's a slightly different argument (it predates most work in read more
  • Tim: This reminded me of the Pleo video Mark posted awhile read more
  • michael studli: i was wonting to know is the game fun to read more

About this Archive

This page is an archive of recent entries in the Personal Geographies category.

Hardware is the previous category.

Pictures is the next category.

Find recent content on the main index or look in the archives to find all content.